

Week 5: Explaining the 3-Statement Model
Information
You may have noticed that this newsletter is arriving a little later than usual. Please accept my apologies for the delay, which was caused by unexpected technical difficulties.
You will also notice that the 3-Statement Model and the Stock of the Week are missing from today’s edition. Due to recent news regarding the company I originally planned to analyze, I have decided to switch to a different stock. I will finalize the new analysis and model within the next week, and you will receive this update completely free of charge.
Introduction
Although the specific stock analysis is delayed, I want to use this edition to focus on the educational foundation required to understand it. Specifically, I want to introduce the concept of the 3-Statement Financial Model.
In the coming week, when I release the full analysis, I will also provide a downloadable 3-Statement Model. The purpose of this model is to help you better understand the mechanics of a company’s financials and to provide a tool you can use for your own research. Please note that the upcoming model is a foundational tool designed for educational purposes, not a comprehensive valuation.
Accordingly, today’s deep dive focuses purely on the theory and structure of this financial framework. In future updates, I will explore more advanced valuation methodologies, such as Discounted Cash Flow (DCF) analysis.
3-Statement Model
A three-statement financial model is an integrated forecasting tool that links a company’s Income Statement, Balance Sheet, and Cash Flow Statement into one dynamic framework. In practice, building this model begins with historical financial data and then projects future revenues, operational costs, assets, liabilities, and cash flows in a connected way. As experts explain, this approach “provides a comprehensive view of a company’s financial health and future trajectory” by showing how changes in one statement affect the others. In other words, it allows financial analysts and executives to see, for example, how a sales forecast drives net income, which then flows into retained earnings and cash. Because all major statements are interlinked, the model can instantly reflect how strategic decisions (like capital investments or cost changes) impact profitability and liquidity across all three statements.
Building a robust 3-statement model is essential for budgeting, valuation, and scenario analysis. By adjusting key assumptions (e.g., sales growth, margins, operational efficiency), users can explore “what-if” scenarios and test the impact of market changes in real time. For example, CFOs often use such models to evaluate different capital allocation plans, since every assumption flows through profit, assets, and cash.
Theory
Building a three-statement model typically follows a step-by-step sequence: input historical data, project the Income Statement (profit & loss), then project the Balance Sheet and Cash Flow Statement together, and finally construct supporting schedules (e.g., depreciation schedule, working capital schedule) that tie everything together.
At the outset, the income statement is projected (using drivers like revenue growth and margins), and the net income flows into the balance sheet as equity (retained earnings). The cash flow statement starts with net income and then makes adjustments for non-cash items and changes in working capital. Once the Income Statement is set up, the model projects assets and liabilities on the Balance Sheet (such as cash, inventory, and payables) so that Assets = Liabilities + Equity. Any timing or non-cash differences between the Income Statement and Balance Sheet are reconciled on the Cash Flow Statement. Overall, a well-structured model ensures that profits “flow” into equity and cash in a self-consistent way.
Key linkages in the three-statement model include:
Net Income → Retained Earnings: Net income (or loss) from the Income Statement is added to retained earnings on the Balance Sheet. In other words, after closing the income statement, the profit feeds equity. Simultaneously, this net income is the first line of the Cash Flow Statement.
Depreciation and Non-Cash Items: Expenses like depreciation reduce net income but do not use cash. Therefore, depreciation is added back on the Cash Flow Statement. In practice, depreciation is subtracted on the Income Statement to determine profit, then added back in the cash flow from operations to determine actual cash generation.
Working Capital Changes: Balance sheet items such as accounts receivable, inventory, and accounts payable affect cash flow. For example, if inventory increases, cash must have been used to buy it; if payables increase, cash was effectively retained. A 3-statement model automatically links each working capital account on the Balance Sheet to the Cash Flow Statement.
Investing (PP&E) Schedule: Capital expenditures (CapEx) for equipment or buildings reduce cash (cash outflow) and increase Property, Plant & Equipment (PP&E) on the Balance Sheet. The model tracks CapEx as an investing activity on the Cash Flow Statement. Conversely, depreciation runs on the Income Statement and reduces PP&E over time.
Financing (Equity/Capital) Flows: Capital decisions are also integrated. For instance, raising new equity capital increases cash and increases Shareholder Equity on the Balance Sheet. Dividends paid out to shareholders would reduce cash and reduce Retained Earnings. These financing decisions link the balance sheet to the cash flow statement.
These linkages ensure internal consistency. The guiding “golden rule” is that every change in a balance sheet account must also be captured on the cash flow statement. Properly built models will automatically enforce the accounting identity Assets = Liabilities + Equity at all times.
Flaws of the System / Risks
While powerful, three-statement models also have pitfalls and limitations. Most importantly, their accuracy depends entirely on the assumptions and inputs. “Garbage in, garbage out” truly applies here: if revenue growth rates or cost estimates are unrealistic, the entire forecast will be misleading. For example, blindly assuming perpetual 20% annual growth without justification can produce infeasible results. The model can only be as good as the data and logic driving it.
Another risk is human or formula error. Complex spreadsheets are prone to mistakes. A single mis-linked cell or hidden formula can throw off an entire model. For instance, if one forgets to include an inventory increase as an outflow on the cash flow statement, the balance sheet will not reconcile and the model “breaks.” Likewise, Excel features like hidden rows/columns can mask missing items or incorrect totals. Without careful auditing (using Excel’s trace tools and thoroughly reconciling each statement), these mistakes can lead to imbalances.
Some models require circular references as part of their logic (e.g., when tax calculations depend on net income, which in turn might be affected by other tax-dependent variables). Such circularities must be managed consciously. Unintentional circular links can lock Excel into infinite loops. To handle this, experienced modelers often enable iterative calculation and clearly label any intentional circular formulas.
Finally, even a flawless model has inherent forecasting limitations. Real-world uncertainties cannot be predicted purely by historical trends. Unforeseen events may render projections invalid. For this reason, analysts complement detailed financial models with qualitative judgment and stress tests.
Conclusion
A well-constructed three-statement financial model is a cornerstone of modern financial planning. By integrating income statements, balance sheets, and cash flows, it provides a unified picture of how business operations and investment decisions affect a company’s performance. When built carefully (with reliable inputs and clear logic), it helps managers and investors understand the “what-if” impacts of their choices. However, users must always apply professional judgment: double-check formulas, avoid hidden errors, and treat projections with healthy skepticism.
In preparing any financial model, it is also important to comply with relevant standards and regulations (such as BaFin or SEC reporting standards). throughout this article, the focus has been on neutral modeling principles. The goal is purely educational: to demystify the mechanics of a 3-statement model so that readers can build, analyze, and use these models responsibly.
Portfolio (December 7, 2025)
Overview
Total Portfolio Value: 471 €
Cash: 8.80 €
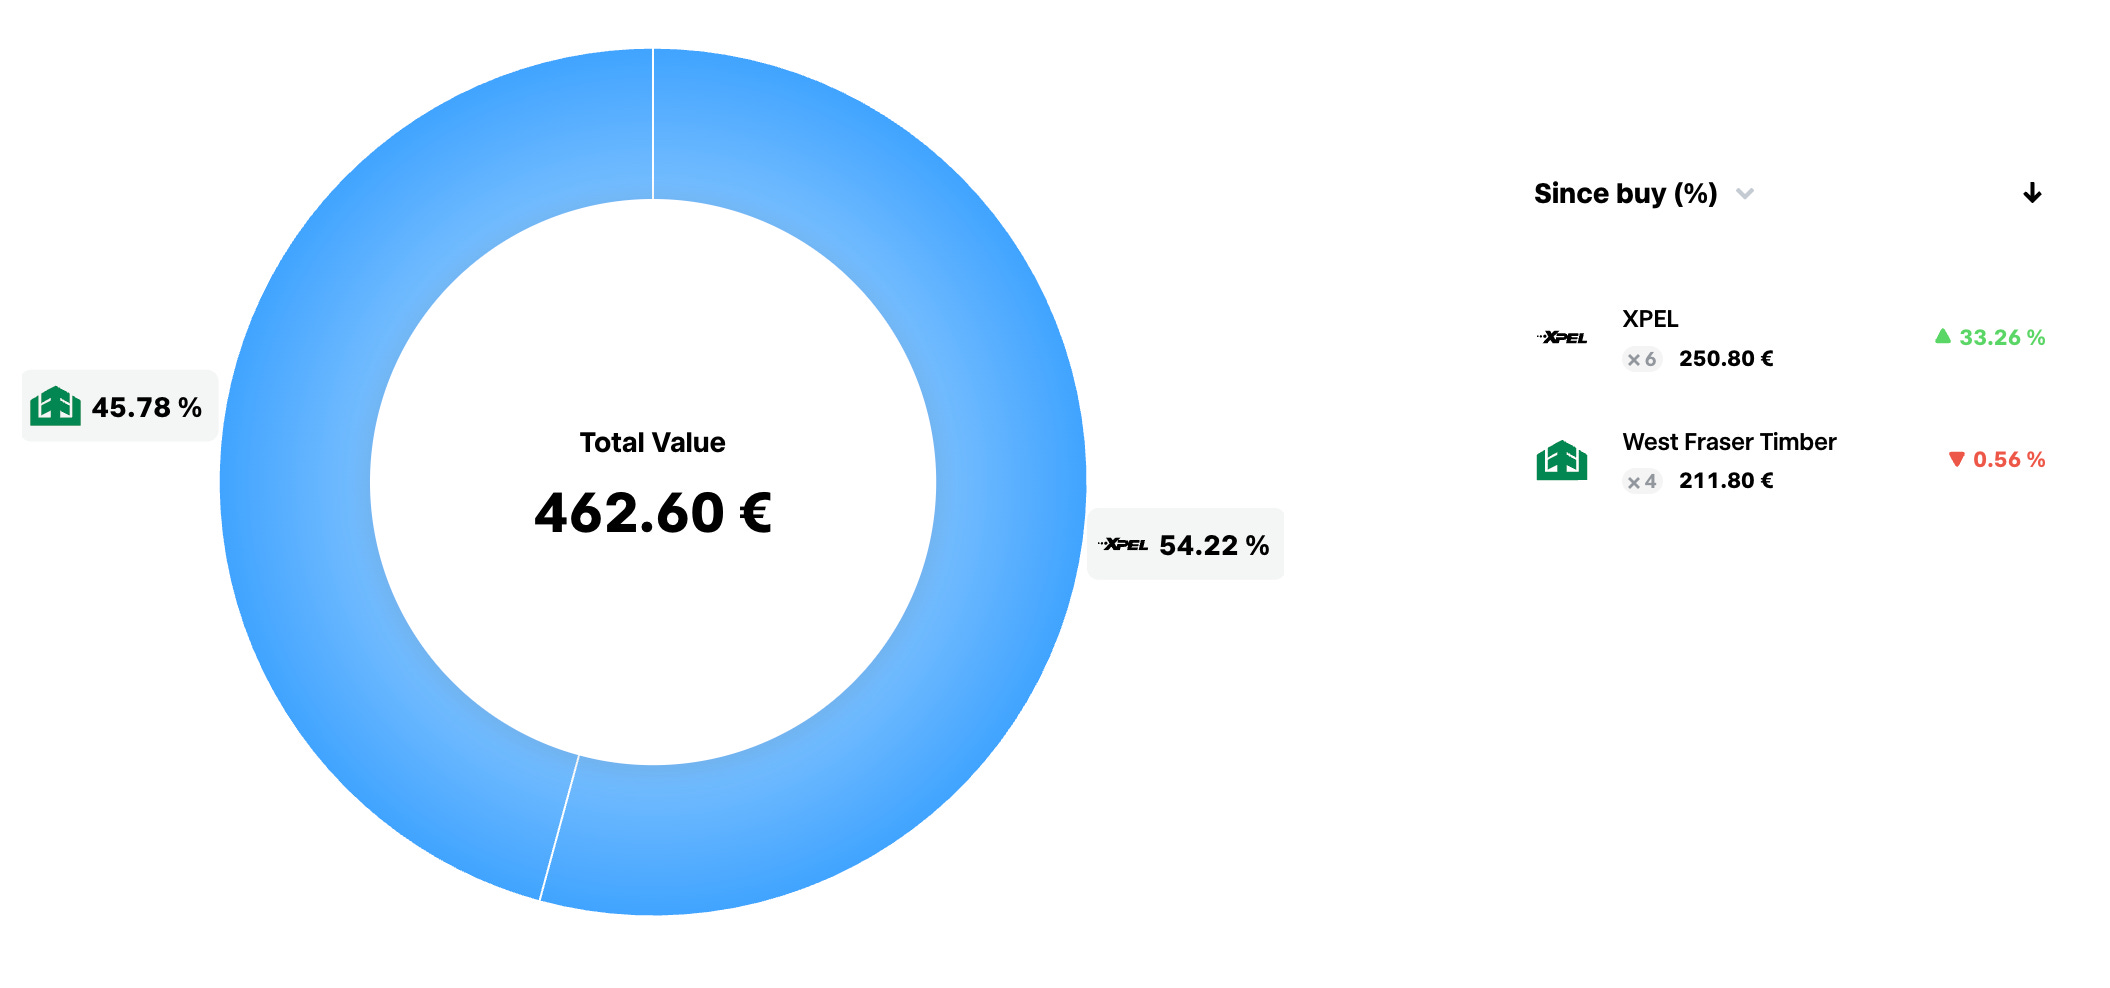
Stocks: 462.60 €
Total Return: +15.59%
Positions
XPEL (Ticker: XPEL)
Change: +33.26%
Shares: 6
Entry Price: 31.20 €
Current Value: 250.8 €
Summary: XPEL, Inc. provides protective films and coatings for vehicles, buildings, and other surfaces. Their main products include paint protection films, window films, and ceramic coatings. The company also offers installation services and software for film design.
West Fraser Timber (Ticker: WFG)
Change: -0.56%
Shares: 4
Entry Price: 53.25 €
Current Value: 211.80 €
Summary: West Fraser Timber Co. Ltd. is a North American wood products manufacturer producing lumber, engineered wood materials, panels, pulp, and paper. The company operates integrated forestry and manufacturing facilities, supplying essential construction and building materials to residential, commercial, and industrial markets.
Deposited Money
Total Deposited (After fees): 410 €
Monthly Savings Rate: 200 €
Fees & Taxes
Deposit Fees: 4.1 €
Order Execution Fees: 2 €
Taxes: 0 €
Portfolio Plan
My investment strategy, as outlined in recent weeks, remains unchanged. My objective is to construct a portfolio consisting of five individual positions. Once this five-position structure is complete, I do not intend to increase my existing long-term holdings. To ensure proper diversification, each position will be selected from a different sector. By strictly monitoring the portfolio’s average beta and standard deviation, I aim to mitigate overall risk and improve long-term stability.
However, this plan remains flexible depending on upcoming macroeconomic data. I am closely monitoring next week’s key events: the Federal Funds Rate decision, the FOMC Economic Projections, the FOMC Statement, and the Press Conference.
Additionally, I view the current AI trend with caution. While US GDP is currently supported by AI-related growth, I am skeptical about the valuation of current investments in this space. In my view, infrastructure is being expanded too rapidly for a technology that is still in its early stages and has yet to prove its monetization potential at scale. Consequently, I plan to exercise extreme caution surrounding Nvidia’s earnings and the upcoming FOMC decisions. Based on the FOMC results next week, I may re-evaluate and adjust my portfolio strategy.
My Thoughts on my holdings
(I currently hold positions in XPEL and West Fraser Timber. This may influence my views)
XPEL
My investment in XPEL has continued its positive trajectory this week, extending the recent month’s growth and exceeding my initial expectations. While I appreciate this performance, I have made the decision to divest from this position, targeting an exit in the second quarter of 2026. Although I believe XPEL has the potential to eventually reclaim its all-time highs, such a recovery typically requires significant time.
Therefore, I have decided to sell my position to reallocate capital into other equities that, in my view, offer greater upside potential. For now, I am waiting for specific key metrics—whether positive or negative—to trigger the final decision. I intend to provide a further update one to two weeks before I execute the sale.
West Fraser Timber
As I have outlined in recent weeks, the lumber and OSB markets are currently navigating a typical low phase within their economic cycle, a situation further complicated by other challenging metrics. Consequently, I am not surprised that the value of my position has remained relatively flat.
I do not anticipate significant volatility or growth in the coming months, as this stock is heavily correlated with the general housing market. In my view, meaningful momentum is likely to emerge around the middle of 2026, and my current plan is to hold this position until the end of that year. However, this outlook remains subject to change based on economic policy decisions from the current US Administration and the FOMC. For now, I intend to wait patiently and focus on analyzing the quarterly reports as they are released.
General information on my holdings
Although my current primary intention is to hold the positions for the long term (over one quarter), my strategy is subject to a quarterly review. There is always a possibility that I may exit a position, even if I believe there is still upside potential.
The reason for this is my strict adherence to a set of internal investment metrics that I evaluate every quarter. If a position no longer meets these specific criteria or if my internal metrics are ‘broken’—I will sell the asset regardless of its growth potential. In the coming months, I plan to provide more detailed information regarding these metrics and the rationale behind my reliance on them.
Disclaimer
This Post is for informational purposes only and does not constitute financial or investment advice. See the full disclaimer on the Project Compound About page.